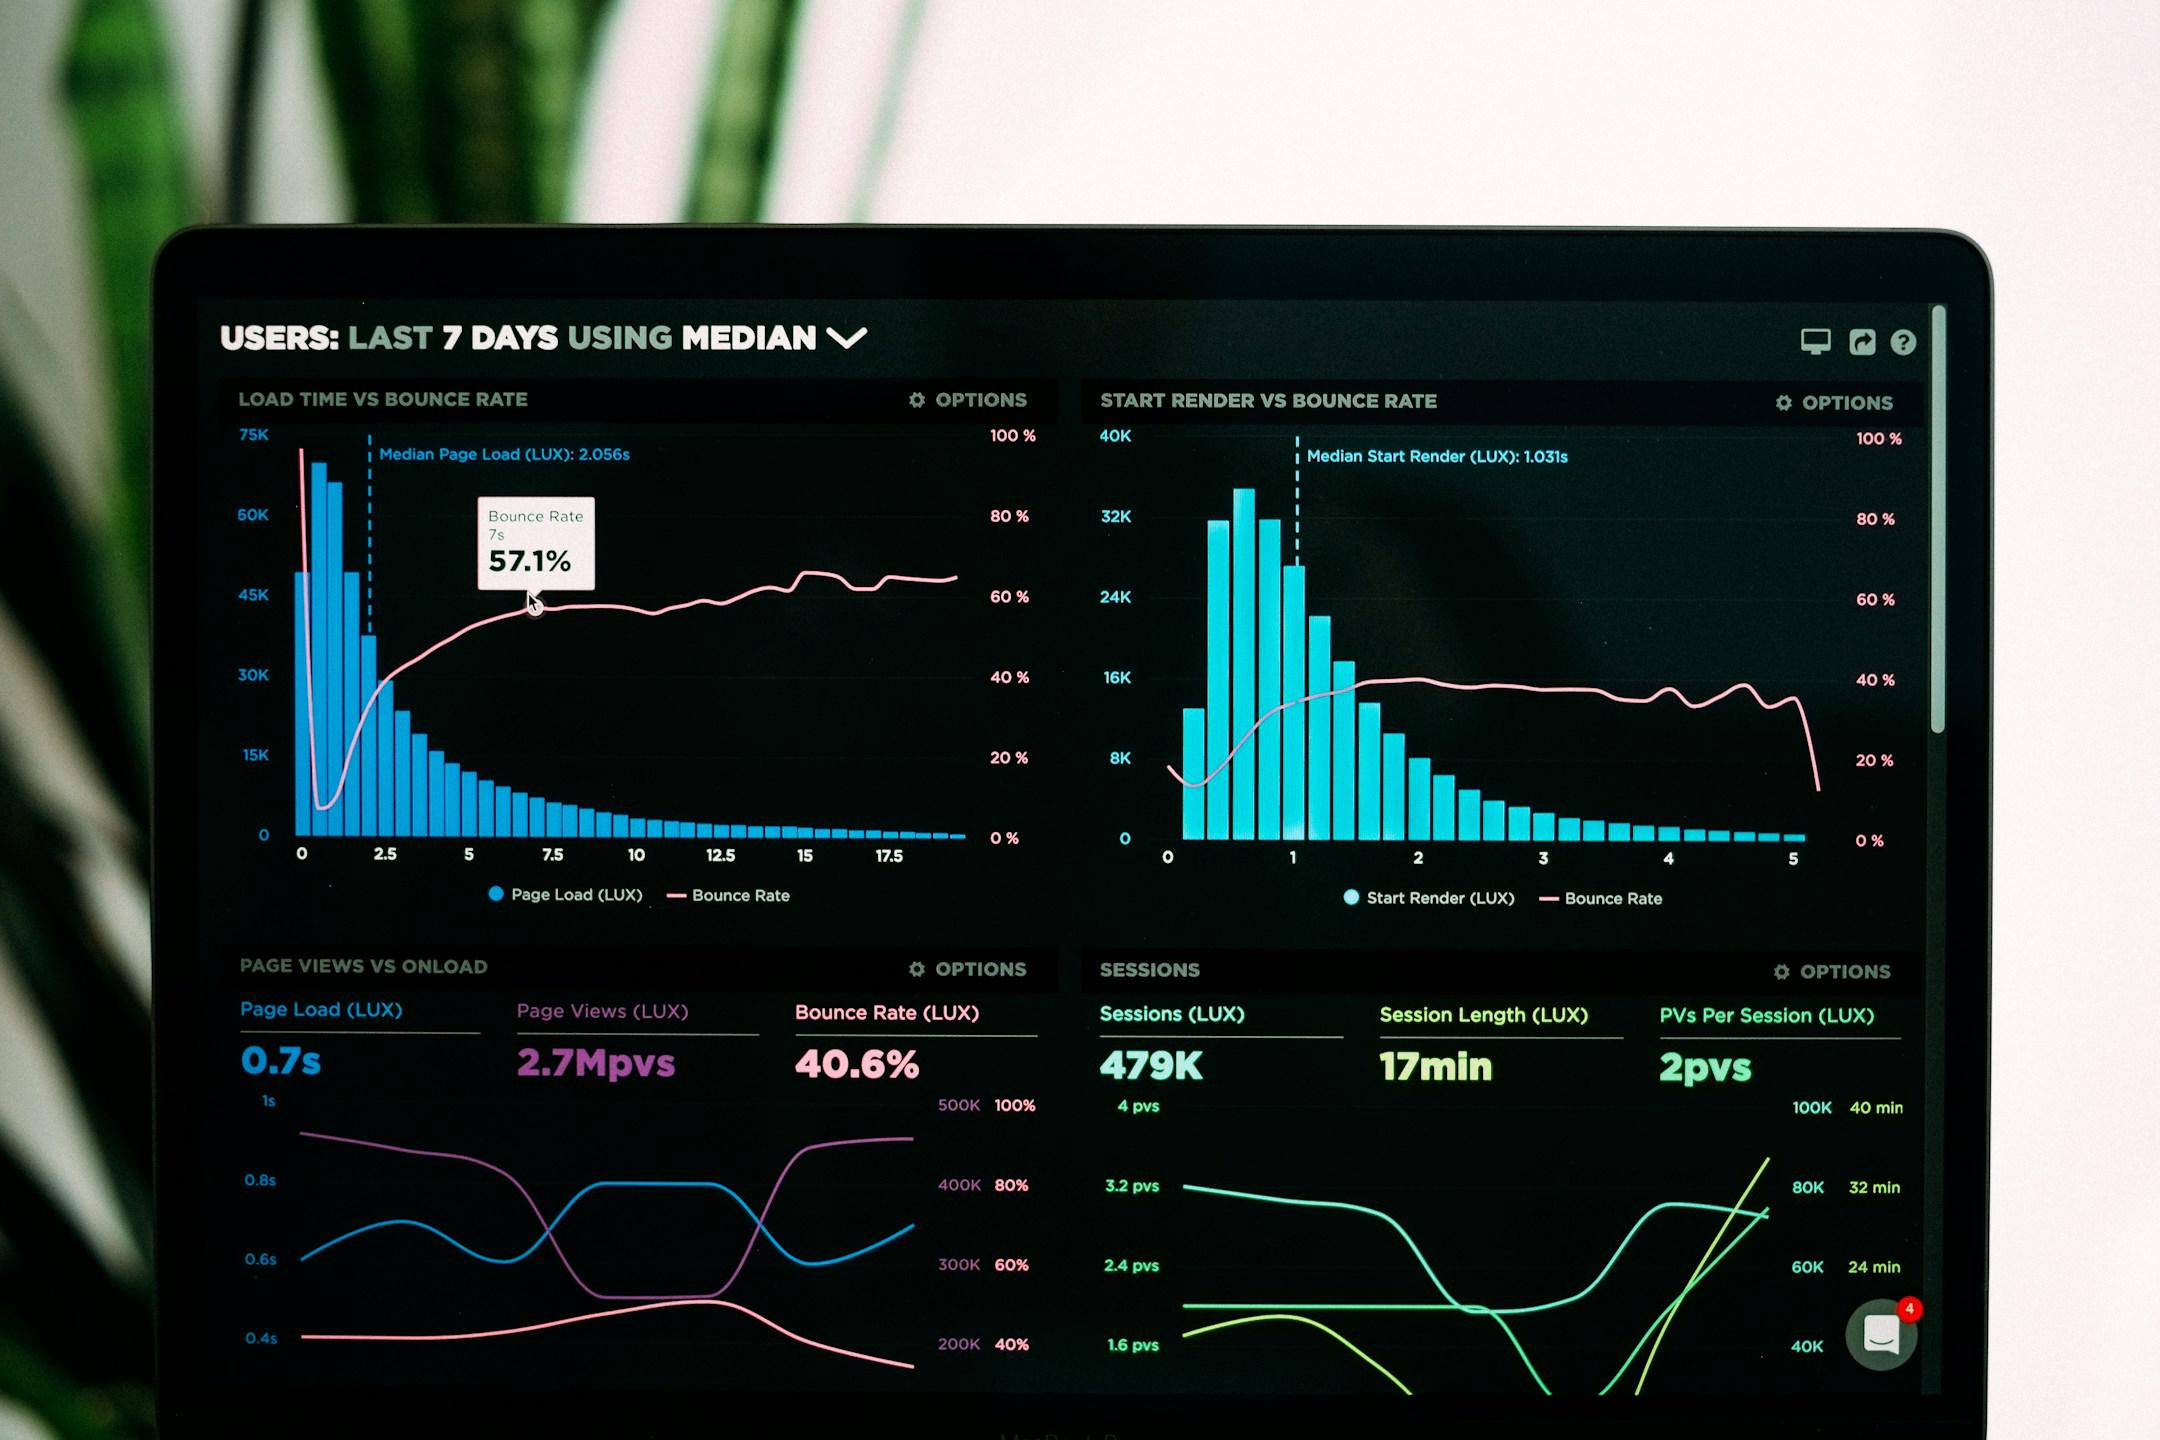
Data analysis and visualization with excel
Dive into the world of data analysis and visualization with our Excel course. Master the art of data interpretation, trend analysis, and insightful reporting using Excel's advanced features. Learn to create dynamic charts, graphs, and dashboards that transform raw data into actionable insights. This course equips you with the skills to extract meaningful information from complex datasets, enabling you to make data-driven decisions that drive business growth and innovation.
